Artificial Intelligence (AI) exuberance continued into the second quarter. Financial speculation in new technologies is nothing new. Railroads, automobiles, computers, and the internet were all built on speculative booms during their early days. We believe AI is the same – both financial bubble and transformative technology. This is good. Transformative technologies bring us new products and services and usher in new companies and employment opportunities1. More importantly, rising living standards rely on new general-purpose technologies. Speculation isn’t necessarily bad either. On the contrary, some measure of speculation is needed to fund new companies and products.
Importantly, speculative bubble downside protection can be managed easily enough. Just avoid sky-high prices and overly optimistic estimates of future cash flows. This is old hat for value curmudgeons like us. The average investor, however, may have a more difficult time avoiding today’s high prices. One reason is that high equity prices have been building for years, and AI is far from the only culprit. The majority of US public equities carry stretched valuations. There are also trouble spots in banks, private equity, and real estate, where assets were over-valued based on inordinately low interest rates and overly optimistic monetization assumptions. Marking these assets to their more likely values has and will continue to prove painful for some investors.
The following are key summary takeaways based on our observations of current market conditions:
- The broader US equity market continues to borrow from the future. By this, we mean equity prices have been expanding faster than values (a simple definition of value in this context is dividends plus real per share earnings growth).
- US equity market P/E multiples appear to be at or near all-time highs. If multiples do not contract, the implication is a broader US equity market fundamental return of 5-7% (1-2% dividend yield plus 4-5% nominal per share earnings growth).
- If history is any guide, P/E multiple contraction and a period of disappointing US equity market returns are more likely. Unfortunately, we have no way of knowing when such a contraction will occur. AI exuberance and speculative prices could go on for years.
- Cyclically adjusted P/E multiples remain an excellent barometer for assessing potential investment returns. Based on our work determining normalized cash earning power for our companies (the “E” in the P/E), the ACR investment team remains confident in our ability to generate satisfactory returns, come what may.
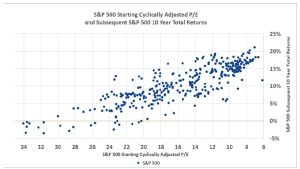
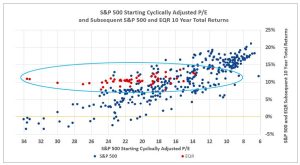
The following charts are courtesy of Nick Taggart, Director, Financial Intermediaries at ACR. The first chart shows beginning S&P 500 cyclically adjusted P/Es and subsequent S&P 500 10-year returns. The second chart overlays EQR’s subsequent 10-year returns over the same period.
Note:
S&P 500 Starting Cyclically Adjusted P/E is based on Real S&P 500 Price Per Share (PPS) divided by Ordinary Least-Squares Regression (OLS) trendline of S&P 500 Real Earnings Per Share (EPS) from 1926 to April 30, 2024.
Price as of April 30, 2024; EPS as April 30, 2024. Sources: S&P Dow Jones Indices; Robert Shiller; BLS- CPI Data; ACR Alpine Capital Research. S&P 500 EPS sourced from Shiller data through December 31, 2023. Most Recent S&P 500 TTM EPS estimate as of March 31, 2024, sourced from Howard Silverblatt.
Each data point represents the forward S&P 500 Subsequent 10 Year Total Returns. Data points in the chart are displayed quarterly.
Sources: ACR Alpine Capital Research, S&P Indices
The data shows a strong relationship between beginning cyclically adjusted P/Es and subsequent 10-year investment returns. Despite the predictive power of cyclically adjusted P/Es, most media commentators seem oblivious to the robust conclusions that can be drawn from this data. For example, the S&P 500 has almost never earned a positive return when the market P/E was above 30. While this does not mean returns will always be terrible from such heights, it does mean there is a high risk of disappointing results when valuations reach these levels. Conversely, S&P 500 returns from single-digit P/Es have been excellent. Again, this does not guarantee great results from these levels, but it does mean there is a high probability of success when overall markets are this cheap. We are about as far from cheap today as we ever have been.
Note:
S&P 500 Starting Cyclically Adjusted P/E is based on Real S&P 500 Price Per Share (PPS) divided by Ordinary Least-Squares Regression (OLS) trendline of S&P 500 Real Earnings Per Share (EPS) from 1926 to April 30, 2024.
Price as of April 30, 2024; EPS as April 30, 2024. Sources: S&P Dow Jones Indices; Robert Shiller; BLS- CPI Data; ACR Alpine Capital Research. S&P 500 EPS sourced from Shiller data through December 31, 2023. Most Recent S&P 500 TTM EPS estimate as of March 31, 2024, sourced from Howard Silverblatt.
Each data point represents the forward S&P 500 and EQR Subsequent 10 Year Total Returns. Data points in the chart are displayed quarterly.
Sources: ACR Alpine Capital Research, S&P Indice
In stark contrast to the overall market, our Equity Quality Return (EQR) strategy has historically performed well regardless of the beginning stock market P/E. There is no secret to how we produced these results: ACR prunes our portfolios of high valuations in speculative markets. We insist on buying not only companies capable of producing durable cash flows, but owning them when their prices are low relative to those cash flows. While the second part has presented a far more difficult challenge in recent years, current valuation data shows we have maintained our discipline2. We will continue to maintain our discipline regardless of how long this period lasts, knowing that if we do our job of owning companies that are creating value via dividends and per share earnings growth, the only thing we might miss is the topsy turvy volatility of prices over-extending, and coming back to earth.
Nick Tompras
July 2024
End Notes:
-
- New technologies as far back as the weaving loom have displaced jobs. In principle, the definition of rising living standards is more (better) products and services with less labor. It follows that the population can either work less (in the form of unemployment or leisure) or work to make new products and services. The fear has been that the new products and services would never develop. The record shows they have at the macro level. At times there may be lags between when current jobs are replaced by automation and when new jobs are created, but in the long-term the unemployment rate has always returned to relatively low levels, with rising unemployment typically caused by recessionary production cycles rather than productivity shocks.
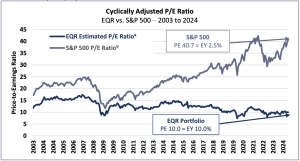
- EQR v S&P 500 Cyclically Adjusted P/E Ratio
Note:
a) EQR Estimated Price-to-Earnings Ratio is the weighted average PE ratio with EPS based on estimated normalized cash earnings for investment holdings in ACR’s Equity Quality Return Strategy. b) ACR CAPE based on Real S&P 500 Price Per Share (PPS) divided by Ordinary Least-Squares Regression (OLS) trendline of S&P 500 Real Earnings Per Share (EPS) from 1926 to June 30, 2024. Price as of June 30, 2024; EPS as of June 30, 2024. Sources: S&P Dow Jones Indices; Robert Shiller; BLS CPI Data; ACR Alpine Capital Research. S&P 500 EPS sourced from Shiller data through March 31, 2024. Most Recent S&P 500 TTM EPS estimate as of June 30, 2024, sourced from Howard Silverblatt.
IMPORTANT DISCLOSURES
ACR Alpine Capital Research LLC is an SEC-registered investment adviser. For more information, please refer to Form ADV on file with the SEC at www.adviserinfo.sec.gov. Registration with the SEC does not imply any particular level of skill or training.
Unless otherwise noted, all statistics highlighted in this research note are sourced from ACR’s analysis.
It should not be assumed that recommendations made in the future will be profitable or will equal the performance of the examples discussed. You should consider any strategy’s investment objectives, risks, charges, and expenses carefully before you invest.
This information should not be used as a general guide to investing or as a source of any specific investment recommendations and makes no implied or expressed recommendations concerning the manner in which an account should or would be handled, as appropriate investment strategies depend upon specific investment guidelines and objectives. This is not an offer to sell or a solicitation to invest.
This information is intended solely to report on investment strategies implemented by Alpine Capital Research (“ACR”). Opinions and estimates offered constitute our judgment as of the date set forth above and are subject to change without notice, as are statements of financial market trends, which are based on current market conditions. There are risks associated with purchasing and selling securities and options thereon, including the risk that you could lose money. All material presented is compiled from sources believed to be reliable, but no guarantee is given as to its accuracy.
The investment outlook represents ACR’s views on the economic factors that may affect the global capital markets. There can be no guarantee that these factors will necessarily occur as ACR anticipates, nor that if they do, they will lead to positive performance returns. There can be no assurance that any objective will be achieved.
The Equity Quality Return (EQR) Total Accounts Composite consists of equity portfolios managed for non-wrap fee and wrap fee clients according to the Firm’s published investment policy. The composite investment policy includes the objective of providing satisfactory absolute and relative results in the long run and preserving capital from permanent loss during periods of economic decline. EQR invests only in publicly traded marketable common stocks. Total Return performance includes unrealized gains, realized gains, dividends, interest, and the re-investment of all income. Pure Gross returns are gross of all fees and do not reflect the deduction of transaction costs in wrap portfolios. Pure Gross returns are supplemental information. Net of ACR Fee returns are Pure Gross returns reduced by 1.0% per annum, which is the standard management fee for the Equity Quality Return strategy. Please refer to our full composite performance presentation with disclosures published under the Strategies section of our website at www.acr-invest.com/strategies/eqr-advised-sma-composite.
The S&P 500 TR Index is a broad-based stock index that includes dividend reinvestment and has been presented as an indication of domestic stock market performance. It is unmanaged and cannot be purchased by investors. See EQR’s full composite presentation at www.acr-invest.com/strategies/eqr-advised-sma-composite
Artificial Intelligence (AI) exuberance continued into the second quarter. Financial speculation in new technologies is nothing new. Railroads, automobiles, computers, and the internet were all built on speculative booms during their early days. We believe AI is the same – both financial bubble and transformative technology. This is good. Transformative technologies bring us new products and services and usher in new companies and employment opportunities1. More importantly, rising living standards rely on new general-purpose technologies. Speculation isn’t necessarily bad either. On the contrary, some measure of speculation is needed to fund new companies and products.
Importantly, speculative bubble downside protection can be managed easily enough. Just avoid sky-high prices and overly optimistic estimates of future cash flows. This is old hat for value curmudgeons like us. The average investor, however, may have a more difficult time avoiding today’s high prices. One reason is that high equity prices have been building for years, and AI is far from the only culprit. The majority of US public equities carry stretched valuations. There are also trouble spots in banks, private equity, and real estate, where assets were over-valued based on inordinately low interest rates and overly optimistic monetization assumptions. Marking these assets to their more likely values has and will continue to prove painful for some investors.
The following are key summary takeaways based on our observations of current market conditions:
The following charts are courtesy of Nick Taggart, Director, Financial Intermediaries at ACR. The first chart shows beginning S&P 500 cyclically adjusted P/Es and subsequent S&P 500 10-year returns. The second chart overlays EQR’s subsequent 10-year returns over the same period.
Note:
S&P 500 Starting Cyclically Adjusted P/E is based on Real S&P 500 Price Per Share (PPS) divided by Ordinary Least-Squares Regression (OLS) trendline of S&P 500 Real Earnings Per Share (EPS) from 1926 to April 30, 2024.
Price as of April 30, 2024; EPS as April 30, 2024. Sources: S&P Dow Jones Indices; Robert Shiller; BLS- CPI Data; ACR Alpine Capital Research. S&P 500 EPS sourced from Shiller data through December 31, 2023. Most Recent S&P 500 TTM EPS estimate as of March 31, 2024, sourced from Howard Silverblatt.
Each data point represents the forward S&P 500 Subsequent 10 Year Total Returns. Data points in the chart are displayed quarterly.
Sources: ACR Alpine Capital Research, S&P Indices
The data shows a strong relationship between beginning cyclically adjusted P/Es and subsequent 10-year investment returns. Despite the predictive power of cyclically adjusted P/Es, most media commentators seem oblivious to the robust conclusions that can be drawn from this data. For example, the S&P 500 has almost never earned a positive return when the market P/E was above 30. While this does not mean returns will always be terrible from such heights, it does mean there is a high risk of disappointing results when valuations reach these levels. Conversely, S&P 500 returns from single-digit P/Es have been excellent. Again, this does not guarantee great results from these levels, but it does mean there is a high probability of success when overall markets are this cheap. We are about as far from cheap today as we ever have been.
Note:
S&P 500 Starting Cyclically Adjusted P/E is based on Real S&P 500 Price Per Share (PPS) divided by Ordinary Least-Squares Regression (OLS) trendline of S&P 500 Real Earnings Per Share (EPS) from 1926 to April 30, 2024.
Price as of April 30, 2024; EPS as April 30, 2024. Sources: S&P Dow Jones Indices; Robert Shiller; BLS- CPI Data; ACR Alpine Capital Research. S&P 500 EPS sourced from Shiller data through December 31, 2023. Most Recent S&P 500 TTM EPS estimate as of March 31, 2024, sourced from Howard Silverblatt.
Each data point represents the forward S&P 500 and EQR Subsequent 10 Year Total Returns. Data points in the chart are displayed quarterly.
Sources: ACR Alpine Capital Research, S&P Indice
In stark contrast to the overall market, our Equity Quality Return (EQR) strategy has historically performed well regardless of the beginning stock market P/E. There is no secret to how we produced these results: ACR prunes our portfolios of high valuations in speculative markets. We insist on buying not only companies capable of producing durable cash flows, but owning them when their prices are low relative to those cash flows. While the second part has presented a far more difficult challenge in recent years, current valuation data shows we have maintained our discipline2. We will continue to maintain our discipline regardless of how long this period lasts, knowing that if we do our job of owning companies that are creating value via dividends and per share earnings growth, the only thing we might miss is the topsy turvy volatility of prices over-extending, and coming back to earth.
Nick Tompras
July 2024
End Notes:
Note:
a) EQR Estimated Price-to-Earnings Ratio is the weighted average PE ratio with EPS based on estimated normalized cash earnings for investment holdings in ACR’s Equity Quality Return Strategy. b) ACR CAPE based on Real S&P 500 Price Per Share (PPS) divided by Ordinary Least-Squares Regression (OLS) trendline of S&P 500 Real Earnings Per Share (EPS) from 1926 to June 30, 2024. Price as of June 30, 2024; EPS as of June 30, 2024. Sources: S&P Dow Jones Indices; Robert Shiller; BLS CPI Data; ACR Alpine Capital Research. S&P 500 EPS sourced from Shiller data through March 31, 2024. Most Recent S&P 500 TTM EPS estimate as of June 30, 2024, sourced from Howard Silverblatt.
IMPORTANT DISCLOSURES
ACR Alpine Capital Research LLC is an SEC-registered investment adviser. For more information, please refer to Form ADV on file with the SEC at www.adviserinfo.sec.gov. Registration with the SEC does not imply any particular level of skill or training.
Unless otherwise noted, all statistics highlighted in this research note are sourced from ACR’s analysis.
It should not be assumed that recommendations made in the future will be profitable or will equal the performance of the examples discussed. You should consider any strategy’s investment objectives, risks, charges, and expenses carefully before you invest.
This information should not be used as a general guide to investing or as a source of any specific investment recommendations and makes no implied or expressed recommendations concerning the manner in which an account should or would be handled, as appropriate investment strategies depend upon specific investment guidelines and objectives. This is not an offer to sell or a solicitation to invest.
This information is intended solely to report on investment strategies implemented by Alpine Capital Research (“ACR”). Opinions and estimates offered constitute our judgment as of the date set forth above and are subject to change without notice, as are statements of financial market trends, which are based on current market conditions. There are risks associated with purchasing and selling securities and options thereon, including the risk that you could lose money. All material presented is compiled from sources believed to be reliable, but no guarantee is given as to its accuracy.
The investment outlook represents ACR’s views on the economic factors that may affect the global capital markets. There can be no guarantee that these factors will necessarily occur as ACR anticipates, nor that if they do, they will lead to positive performance returns. There can be no assurance that any objective will be achieved.
The Equity Quality Return (EQR) Total Accounts Composite consists of equity portfolios managed for non-wrap fee and wrap fee clients according to the Firm’s published investment policy. The composite investment policy includes the objective of providing satisfactory absolute and relative results in the long run and preserving capital from permanent loss during periods of economic decline. EQR invests only in publicly traded marketable common stocks. Total Return performance includes unrealized gains, realized gains, dividends, interest, and the re-investment of all income. Pure Gross returns are gross of all fees and do not reflect the deduction of transaction costs in wrap portfolios. Pure Gross returns are supplemental information. Net of ACR Fee returns are Pure Gross returns reduced by 1.0% per annum, which is the standard management fee for the Equity Quality Return strategy. Please refer to our full composite performance presentation with disclosures published under the Strategies section of our website at www.acr-invest.com/strategies/eqr-advised-sma-composite.
The S&P 500 TR Index is a broad-based stock index that includes dividend reinvestment and has been presented as an indication of domestic stock market performance. It is unmanaged and cannot be purchased by investors. See EQR’s full composite presentation at www.acr-invest.com/strategies/eqr-advised-sma-composite
More Posts
Estate Planning: Beyond the Will
Mr. Market, Riding High – Q4 2024
Secular Bulls and Bears – Q3 2024
Own or Rent? Important Considerations to Review before Purchasing a Vacation Property