More pundits dissect daily market fluctuations and the latest tick of economic data than ever before. To us, this is like trying to find your way through the forest by scrutinizing the bark of every tree. Investing in companies, public or private, is a long-term endeavor. It requires stepping back to see where you are, to understand where you might be going. In this quarter’s commentary, we begin by sharing three observations from our review of US stock market history:
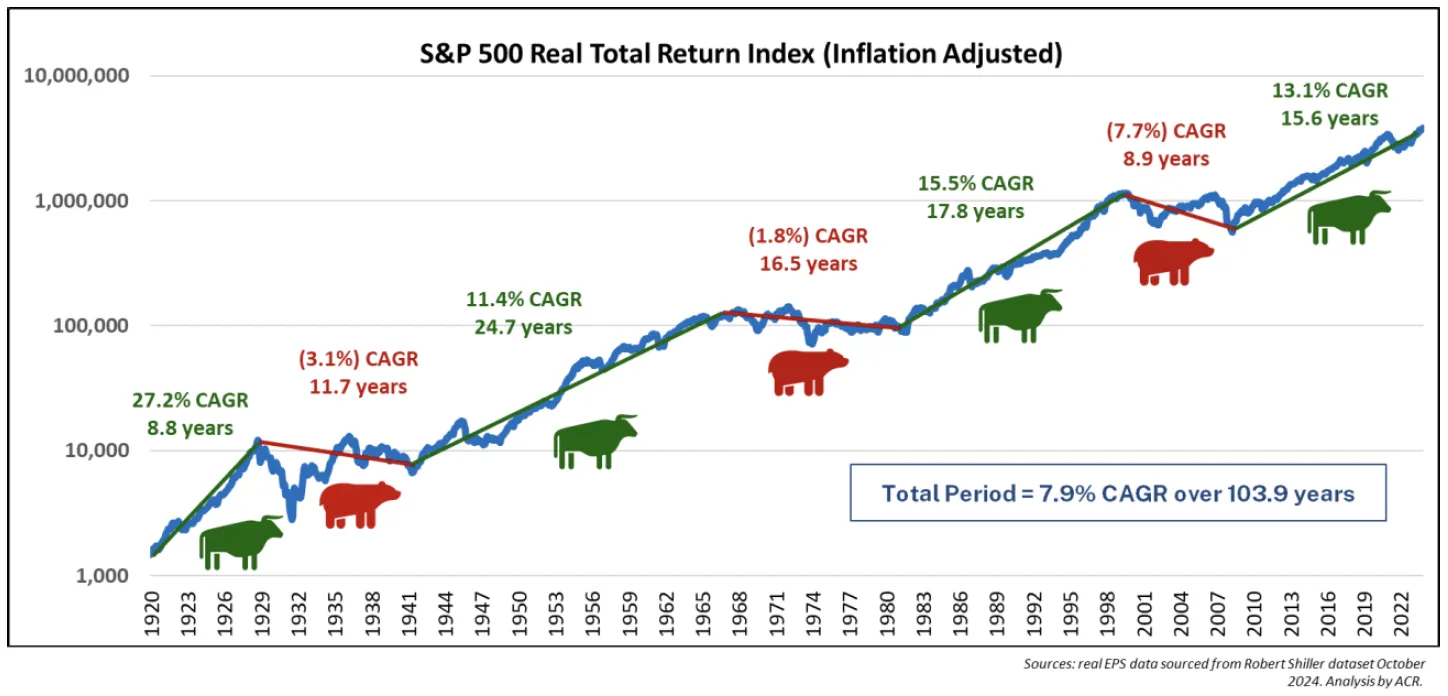
- US stock market history shows seven secular market cycles over the past hundred or so years –four bulls and three bears.
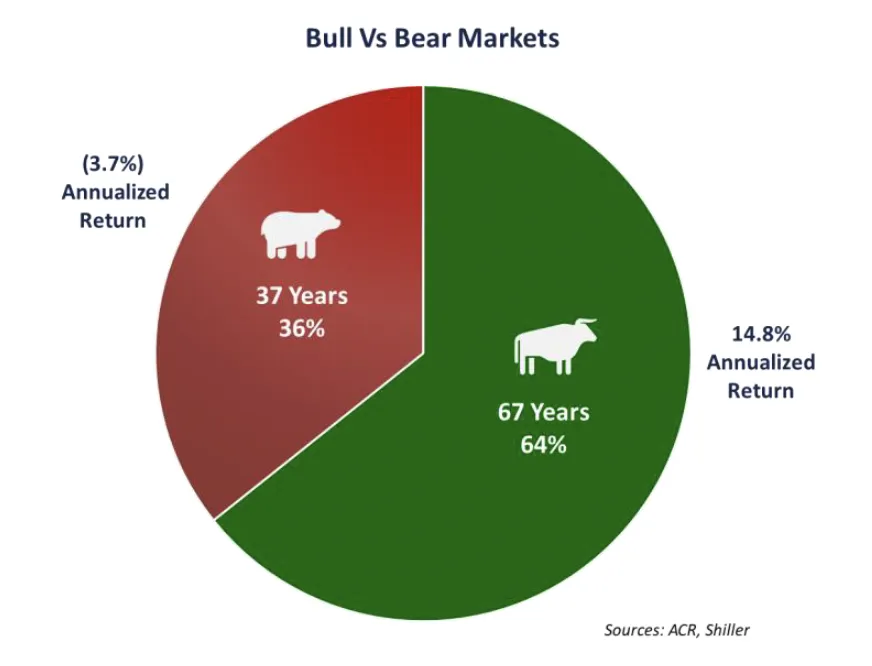
- Long-term market performance is radically different – alternatingly excellent and destructive –depending on whether you started in a secular bull or bear.
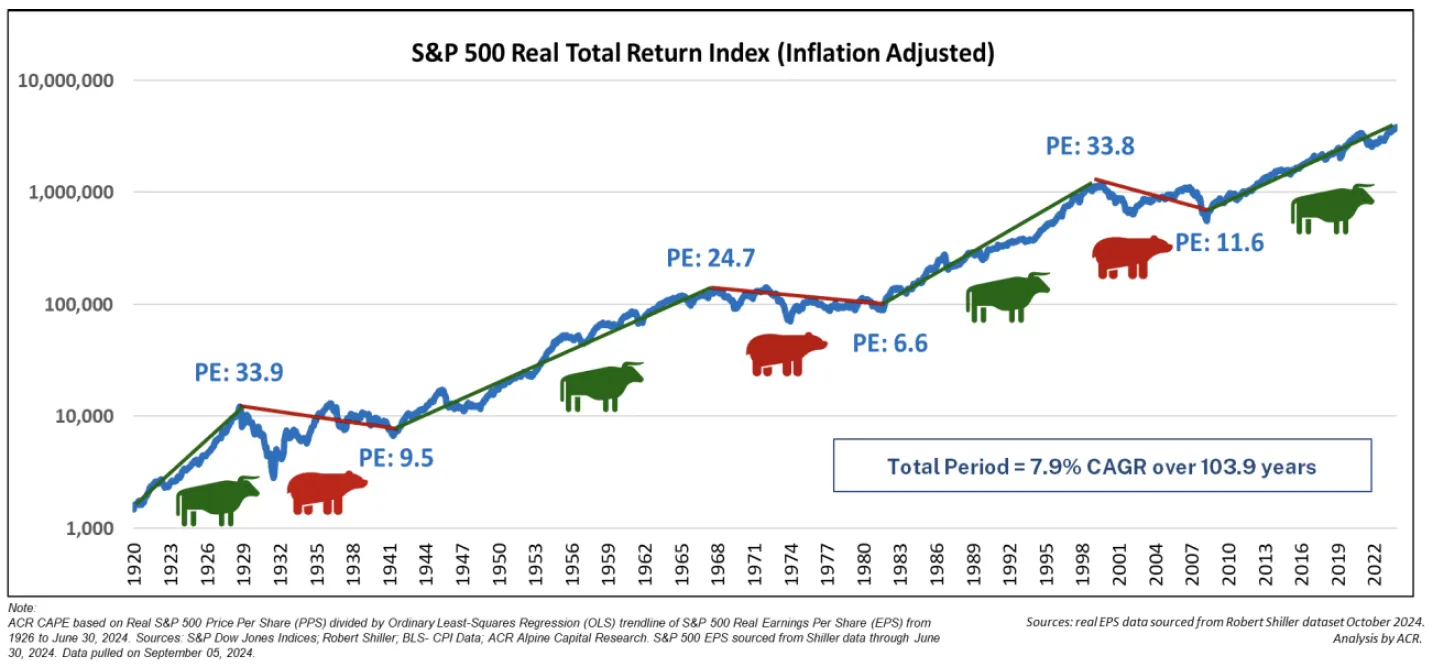
- The secular bulls and bears are nothing more than extremes in prices relative to profits. Thepath to investment success is, therefore, to focus on profits and not overpay for them.
Stock market history shows seven secular market cycles over the past hundred or so years – four bulls and three bears. Despite the daily, quarterly, and yearly ups and downs, even despite bear markets defined as declines of 20% or more (there have been 12), the wider vista of market history shows the great bulls and bears have been few and long.

The results above are adjusted for inflation; otherwise, it would be impossible to accurately compare the Great Depression and Great Inflation bear markets. The average bull lasted 16.7 years, and the average bear 12.3 years. Such stretches fall outside the performance measurement horizon of nearly all investors. This is problematic since an effective assessment of results ought to include both types of markets.
Long-term market performance is radically different depending on whether you started in a secular bull or bear. Greater than one-third of the years since 1920 occurred during secular bear markets averaging a real return (inflation-adjusted) of –3.7% per year. Conversely, the secular bull years averaged a phenomenal real return (inflation-adjusted) of 14.8% per year. Most investors want to know at this point: how do you protect from the bears while participating in the bulls?

The secular bulls and bears are nothing more than extremes in prices relative to profit. The path to investment success is, therefore, to focus on profits and not overpay for them. The following chart reveals the compass by which investors can navigate the great bulls and bears. Bull markets always culminate in a historically high P/E. The extremely high valuations then set the stage for long bears which bottom at a historically low P/E.

There is no economic law stating that the pattern of secular bull and bear markets should or will continue. Nor does mapping market history allow one to forecast turning points. Yet what we do know is still meaningful. As our data showed from last quarter’s commentary (Borrowing from the Future), returns are highly likely to be lower from higher starting multiples, and higher from lower starting multiples. So, what do we do with this knowledge?
Our solution to protect from the bears while participating in the bulls is to carefully prune our portfolios of high prices during the bulls to help assure satisfactory returns during the bears. At historically high P/Es like those today, our portfolios will have very different characteristics and performance than the market. During the current bull, which began after the Great Financial Crisis ended, our flagship Equity Quality Return (EQR) strategy has generated double-digit returns. Yet we lagged the market. We don’t mind temporarily falling behind. Our recipe for generating satisfactory absolute and superior relative returns during the 2000-2009 Bear Market required falling behind in the 1990s. The ultimate key is to be well ahead after having gone through both a secular bull and bear, which EQR has done.
The long-term pattern of secular bulls and bears is probably a behavioral phenomenon. One need look no further than the US Presidential Election of 2024 to see that human beings are as emotionally charged (putting it politely) as ever. Therefore, our belief is that we will see a secular bear again someday. Either way, ACR is focused on protecting from unsatisfactory returns by owning a group of companies that are reasonably priced relative to their future profits. Today, that is easier said than done.
Nick Tompras
October 2024
Important Disclosures
ACR Alpine Capital Research LLC is an SEC-registered investment adviser. For more information, please refer to Form ADV on file with the SEC at www.adviserinfo.sec.gov. Registration with the SEC does not imply any particular level of skill or training.
Unless otherwise noted, all statistics highlighted in this research note are sourced from ACR’s analysis.
It should not be assumed that recommendations made in the future will be profitable or will equal the performance of the examples discussed. You should consider any strategy’s investment objectives, risks, charges, and expenses carefully before you invest.
This information should not be used as a general guide to investing or as a source of any specific investment recommendations and makes no implied or expressed recommendations concerning the manner in which an account should or would be handled, as appropriate investment strategies depend upon specific investment guidelines and objectives. This is not an offer to sell or a solicitation to invest.
This information is intended solely to report on investment strategies implemented by Alpine Capital Research (“ACR”). Opinions and estimates offered constitute our judgment as of the date set forth above and are subject to change without notice, as are statements of financial market trends, which are based on current market conditions. There are risks associated with purchasing and selling securities and options thereon, including the risk that you could lose money. All material presented is compiled from sources believed to be reliable, but no guarantee is given as to its accuracy.
The investment outlook represents ACR’s views on the economic factors that may affect the global capital markets. There can be no guarantee that these factors will necessarily occur as ACR anticipates, nor that if they do, they will lead to positive performance returns. There can be no assurance that any objective will be achieved.
The Equity Quality Return (EQR) Total Accounts Composite consists of equity portfolios managed for non-wrap fee and wrap fee clients according to the Firm’s published investment policy. The composite investment policy includes the objective of providing satisfactory absolute and relative results in the long run and preserving capital from permanent loss during periods of economic decline. EQR invests only in publicly traded marketable common stocks. Total Return performance includes unrealized gains, realized gains, dividends, interest, and the re-investment of all income. Pure Gross returns are gross of all fees and do not reflect the deduction of transaction costs in wrap portfolios. Pure Gross returns are supplemental information. Net of ACR Fee returns are Pure Gross returns reduced by 1.0% per annum, which is the standard management fee for the Equity Quality Return strategy. Please refer to our full composite performance presentation with disclosures published under the Strategies section of our website at www.acr-invest.com/strategies/eqr-advised-sma-composite.
The S&P 500 TR Index is a broad-based stock index that includes dividend reinvestment and has been presented as an indication of domestic stock market performance. It is unmanaged and cannot be purchased by investors. See EQR’s full composite presentation at www.acr-invest.com/strategies/eqr-advised-sma-composite.
More pundits dissect daily market fluctuations and the latest tick of economic data than ever before. To us, this is like trying to find your way through the forest by scrutinizing the bark of every tree. Investing in companies, public or private, is a long-term endeavor. It requires stepping back to see where you are, to understand where you might be going. In this quarter’s commentary, we begin by sharing three observations from our review of US stock market history:
Stock market history shows seven secular market cycles over the past hundred or so years – four bulls and three bears. Despite the daily, quarterly, and yearly ups and downs, even despite bear markets defined as declines of 20% or more (there have been 12), the wider vista of market history shows the great bulls and bears have been few and long.
The results above are adjusted for inflation; otherwise, it would be impossible to accurately compare the Great Depression and Great Inflation bear markets. The average bull lasted 16.7 years, and the average bear 12.3 years. Such stretches fall outside the performance measurement horizon of nearly all investors. This is problematic since an effective assessment of results ought to include both types of markets.
Long-term market performance is radically different depending on whether you started in a secular bull or bear. Greater than one-third of the years since 1920 occurred during secular bear markets averaging a real return (inflation-adjusted) of –3.7% per year. Conversely, the secular bull years averaged a phenomenal real return (inflation-adjusted) of 14.8% per year. Most investors want to know at this point: how do you protect from the bears while participating in the bulls?
The secular bulls and bears are nothing more than extremes in prices relative to profit. The path to investment success is, therefore, to focus on profits and not overpay for them. The following chart reveals the compass by which investors can navigate the great bulls and bears. Bull markets always culminate in a historically high P/E. The extremely high valuations then set the stage for long bears which bottom at a historically low P/E.
There is no economic law stating that the pattern of secular bull and bear markets should or will continue. Nor does mapping market history allow one to forecast turning points. Yet what we do know is still meaningful. As our data showed from last quarter’s commentary (Borrowing from the Future), returns are highly likely to be lower from higher starting multiples, and higher from lower starting multiples. So, what do we do with this knowledge?
Our solution to protect from the bears while participating in the bulls is to carefully prune our portfolios of high prices during the bulls to help assure satisfactory returns during the bears. At historically high P/Es like those today, our portfolios will have very different characteristics and performance than the market. During the current bull, which began after the Great Financial Crisis ended, our flagship Equity Quality Return (EQR) strategy has generated double-digit returns. Yet we lagged the market. We don’t mind temporarily falling behind. Our recipe for generating satisfactory absolute and superior relative returns during the 2000-2009 Bear Market required falling behind in the 1990s. The ultimate key is to be well ahead after having gone through both a secular bull and bear, which EQR has done.
The long-term pattern of secular bulls and bears is probably a behavioral phenomenon. One need look no further than the US Presidential Election of 2024 to see that human beings are as emotionally charged (putting it politely) as ever. Therefore, our belief is that we will see a secular bear again someday. Either way, ACR is focused on protecting from unsatisfactory returns by owning a group of companies that are reasonably priced relative to their future profits. Today, that is easier said than done.
Nick Tompras
October 2024
ACR Alpine Capital Research LLC is an SEC-registered investment adviser. For more information, please refer to Form ADV on file with the SEC at www.adviserinfo.sec.gov. Registration with the SEC does not imply any particular level of skill or training.
Unless otherwise noted, all statistics highlighted in this research note are sourced from ACR’s analysis.
It should not be assumed that recommendations made in the future will be profitable or will equal the performance of the examples discussed. You should consider any strategy’s investment objectives, risks, charges, and expenses carefully before you invest.
This information should not be used as a general guide to investing or as a source of any specific investment recommendations and makes no implied or expressed recommendations concerning the manner in which an account should or would be handled, as appropriate investment strategies depend upon specific investment guidelines and objectives. This is not an offer to sell or a solicitation to invest.
This information is intended solely to report on investment strategies implemented by Alpine Capital Research (“ACR”). Opinions and estimates offered constitute our judgment as of the date set forth above and are subject to change without notice, as are statements of financial market trends, which are based on current market conditions. There are risks associated with purchasing and selling securities and options thereon, including the risk that you could lose money. All material presented is compiled from sources believed to be reliable, but no guarantee is given as to its accuracy.
The investment outlook represents ACR’s views on the economic factors that may affect the global capital markets. There can be no guarantee that these factors will necessarily occur as ACR anticipates, nor that if they do, they will lead to positive performance returns. There can be no assurance that any objective will be achieved.
The Equity Quality Return (EQR) Total Accounts Composite consists of equity portfolios managed for non-wrap fee and wrap fee clients according to the Firm’s published investment policy. The composite investment policy includes the objective of providing satisfactory absolute and relative results in the long run and preserving capital from permanent loss during periods of economic decline. EQR invests only in publicly traded marketable common stocks. Total Return performance includes unrealized gains, realized gains, dividends, interest, and the re-investment of all income. Pure Gross returns are gross of all fees and do not reflect the deduction of transaction costs in wrap portfolios. Pure Gross returns are supplemental information. Net of ACR Fee returns are Pure Gross returns reduced by 1.0% per annum, which is the standard management fee for the Equity Quality Return strategy. Please refer to our full composite performance presentation with disclosures published under the Strategies section of our website at www.acr-invest.com/strategies/eqr-advised-sma-composite.
The S&P 500 TR Index is a broad-based stock index that includes dividend reinvestment and has been presented as an indication of domestic stock market performance. It is unmanaged and cannot be purchased by investors. See EQR’s full composite presentation at www.acr-invest.com/strategies/eqr-advised-sma-composite.
More Posts
How Geopolitical Developments Can Impact Markets and What This May Mean for Your Portfolio
Capital Protection and Volatility
Finding Self-Worth in Retirement
Trump Tariffs, Business Chaos, and Valuation Adjustment – Q1 2025